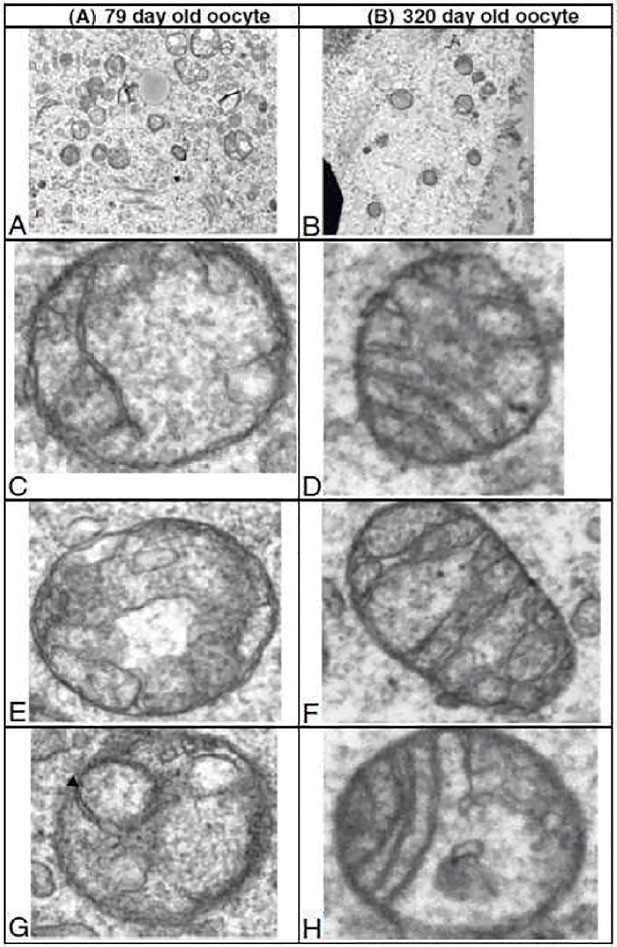
Figure 11. TEM images of mitochondria from young and old mice oocytes. MII oocytes from hyperstimulated young and old mice were evaluated and the mitochondrial structures were compared. Representative electron micrographs of ooplasm at 11,000x magnification are shown; higher magnification views of individual mitochondria are also presented. (A) abundant mitochondria per field, also notice different size mitochondria compared to B. (B) relatively few mitochondria of uniform size per field in ooplasm of an aged animal. (C & E) undifferentiated round mitochondria with an electron dense matrix vs D, F & H. More differentiated mitochondria with an elongated shape and distinct cristae G. arrow indicating vacuoles within mitochondria, Kushnir et al. (2012) with permission.